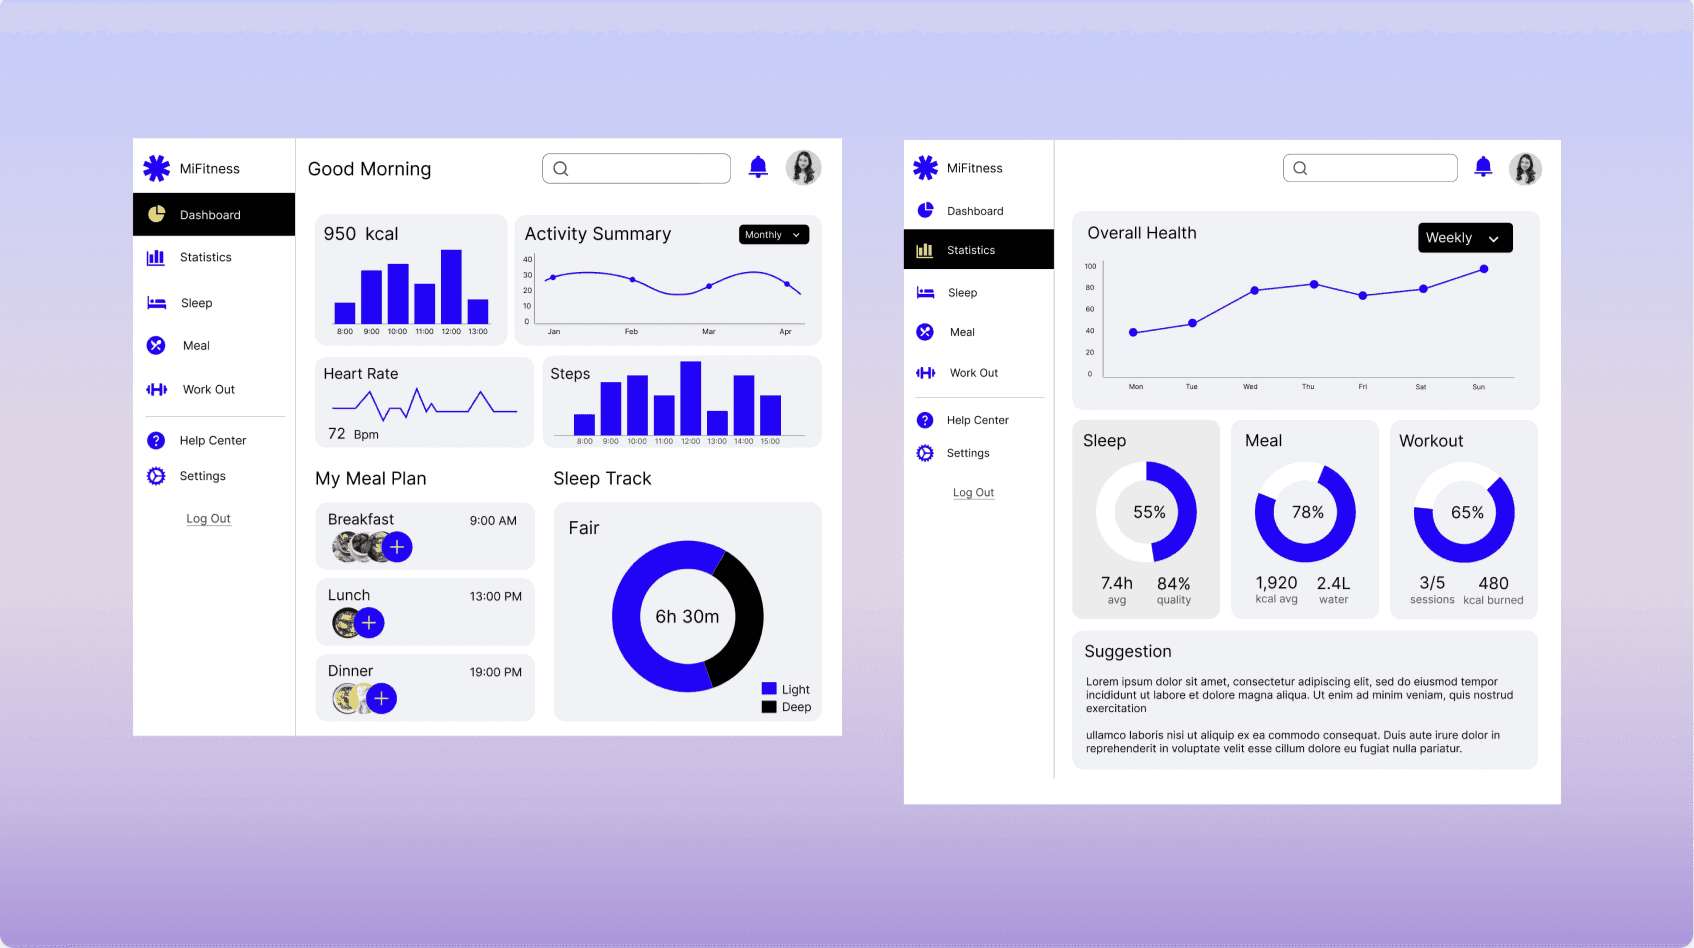
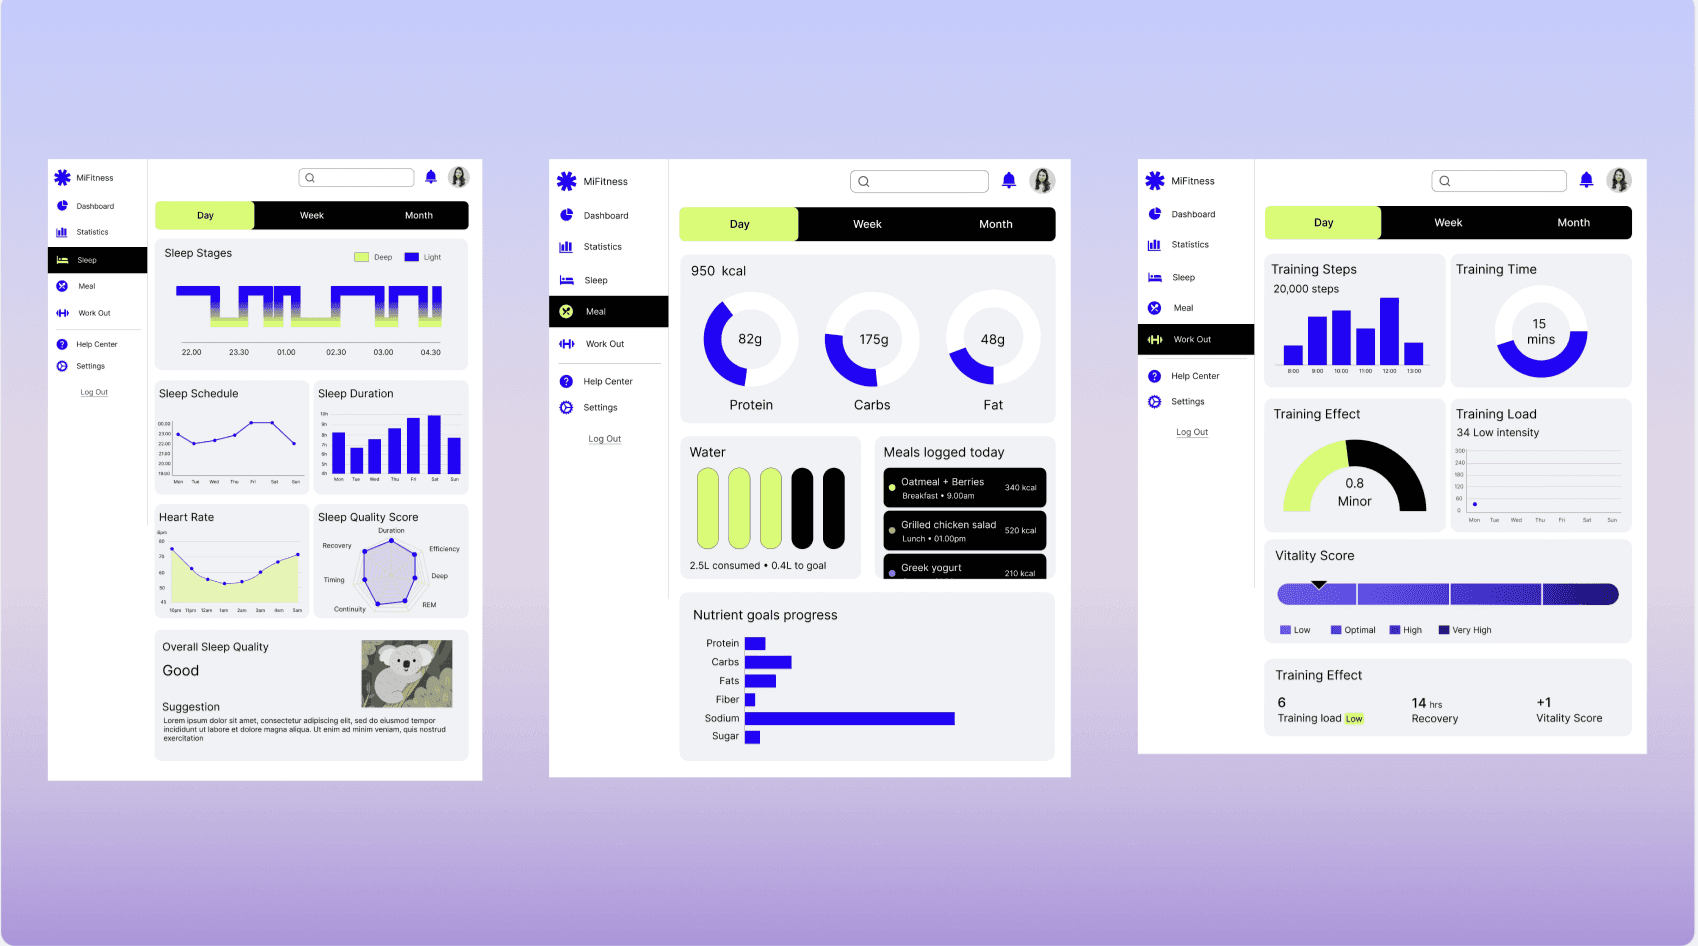
Health Track Dashboard
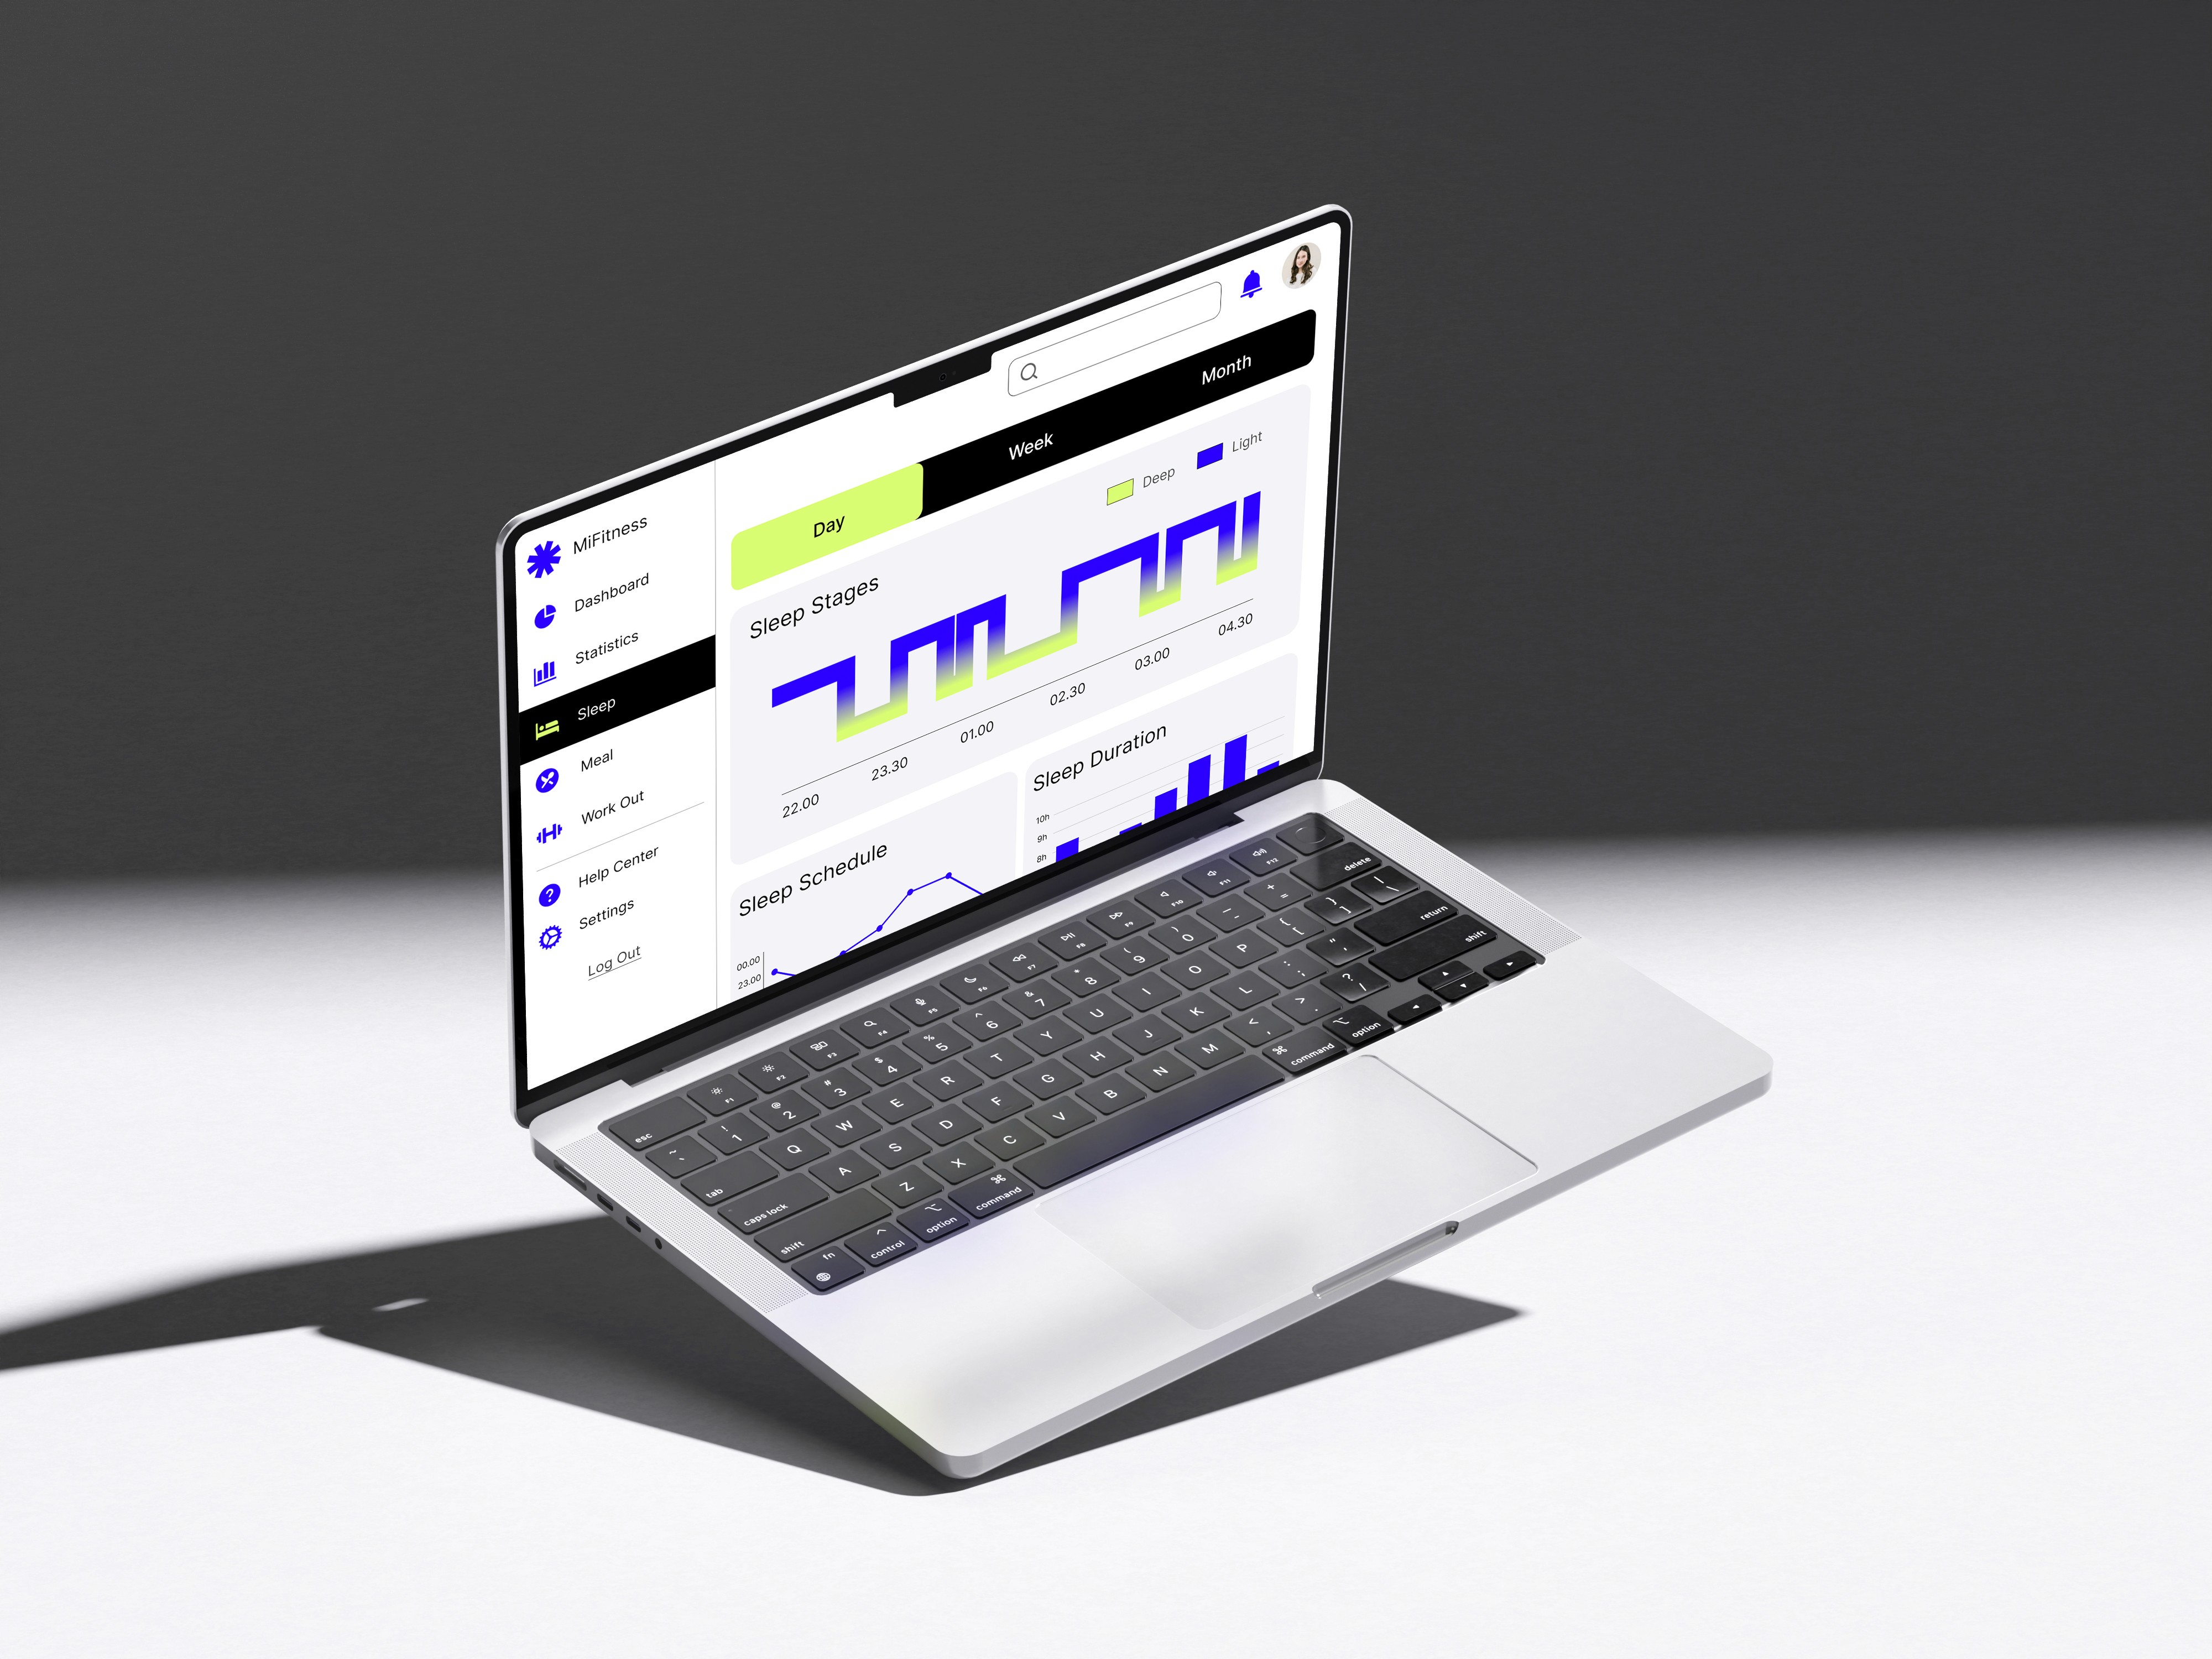
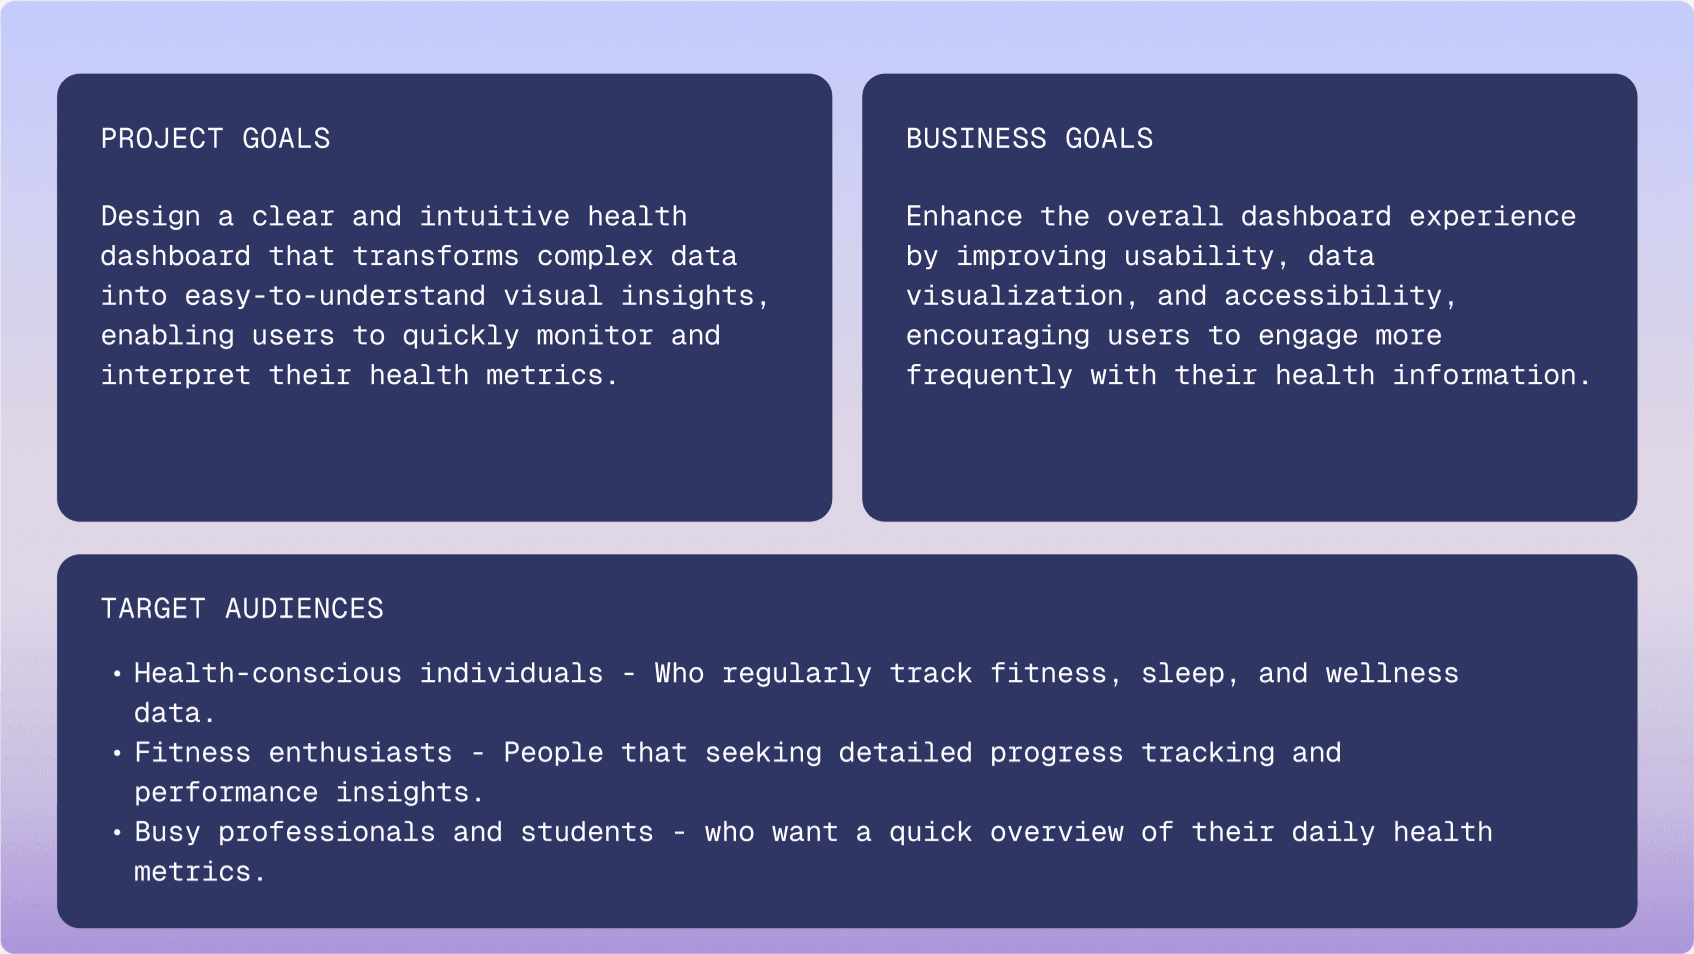
A health dashboard concept designed for Mi Fitness that presents personal health data through intuitive charts, clear visual hierarchy, and a user-centered interface, making complex information easier to understand at a glance.
Product Design


Project Overview
Project: Health Tracking Dashboard
Industry: Health & Data Visualization
Timeline: 4 weeks (2026)
My Role: Lead Product Designer
This concept project reimagines the dashboard experience for the Mi Fitness app by transforming health data into clear, actionable insights. Using my personal Mi Fitness data, I cleaned and organized the dataset in Excel, created the initial charts and graphs, and then designed and prototyped a complete dashboard in Figma. The project focuses on intuitive data visualization, clear visual hierarchy, and a modern interface that helps users quickly understand their health metrics.
Design Approach
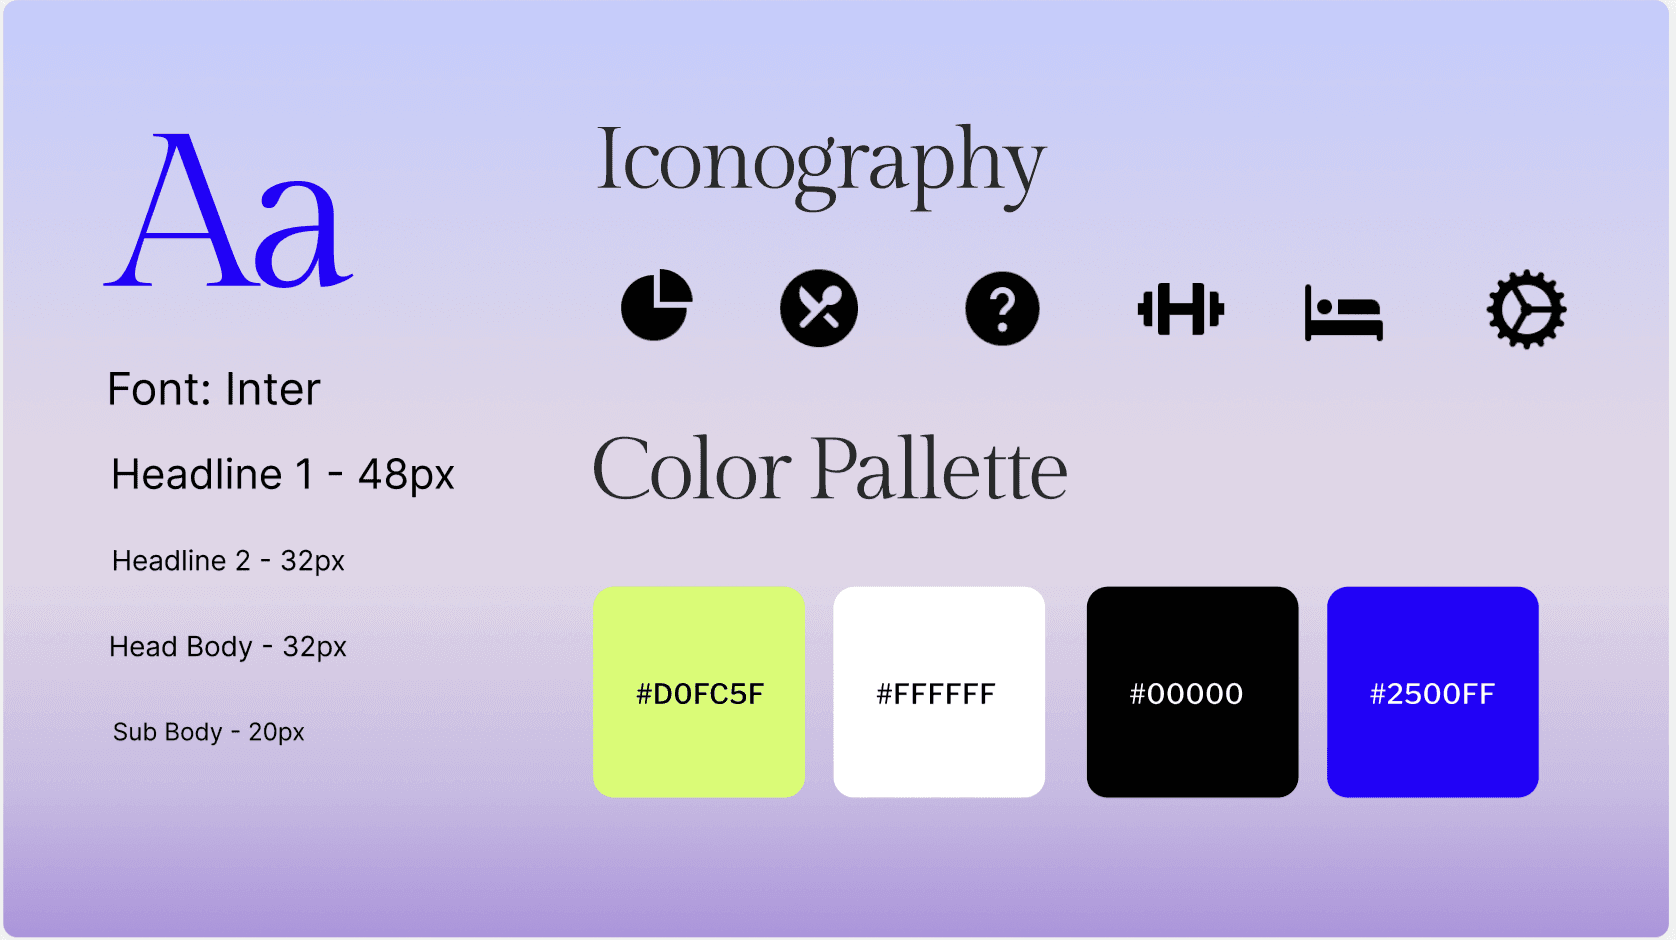
The design uses a bold and modern visual style with a high-contrast color palette of electric blue, lime green, black, and white. Inter is used for its clean and readable typography, while simple iconography helps users quickly recognize different health metrics.
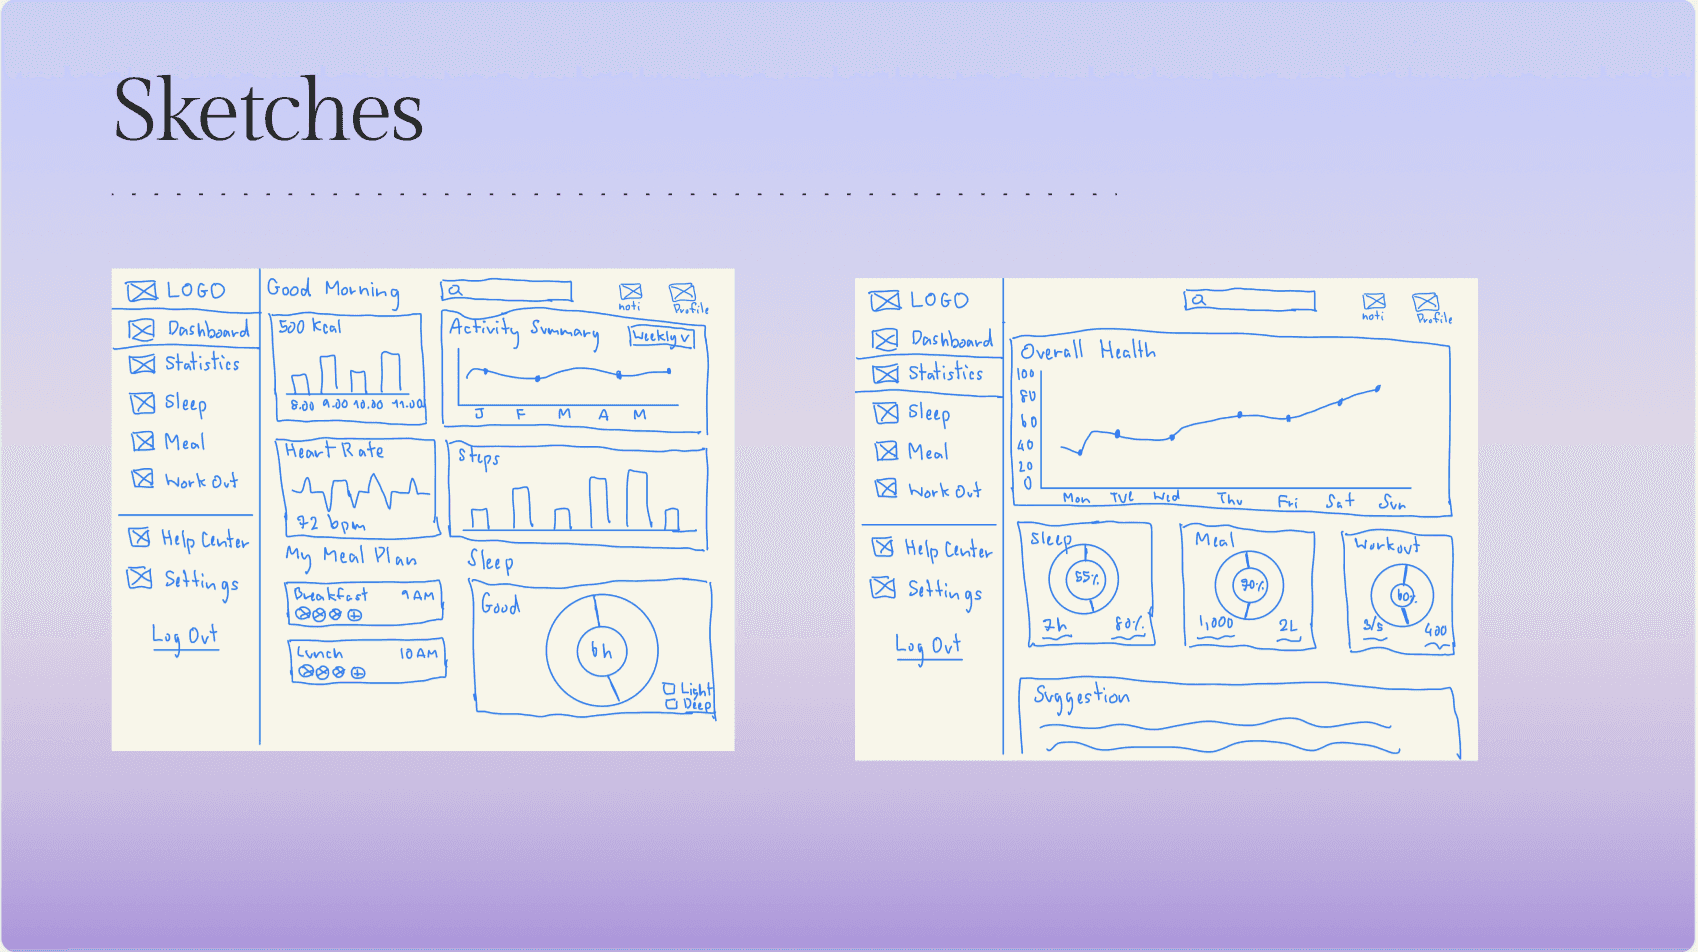
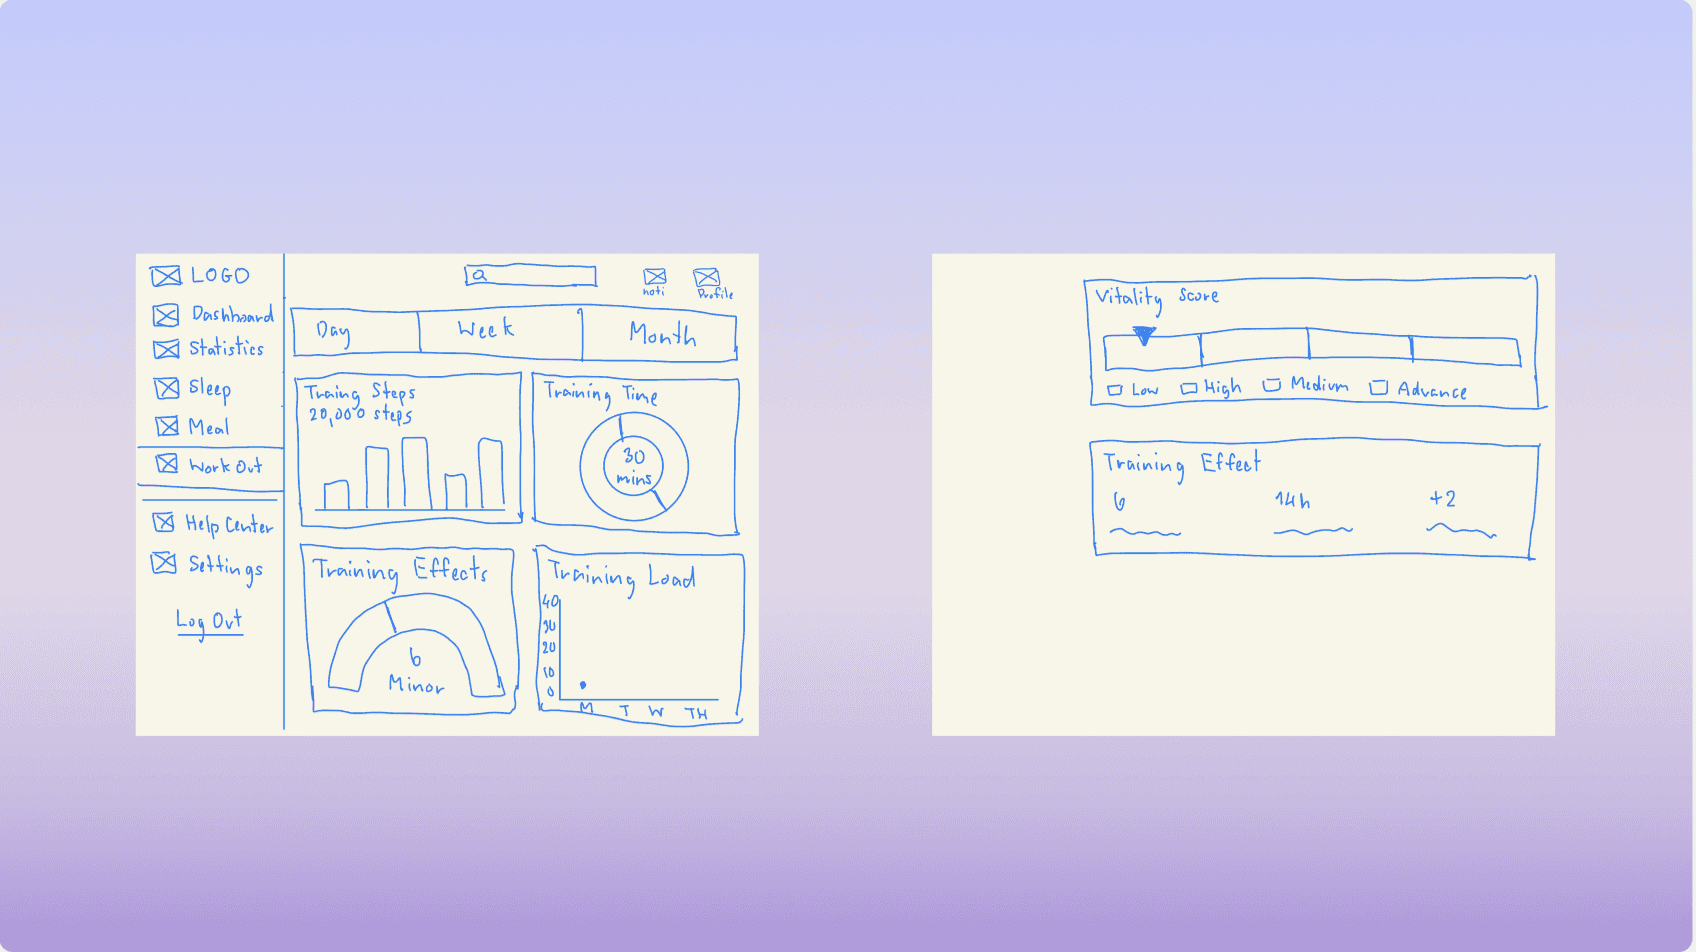
Sketches
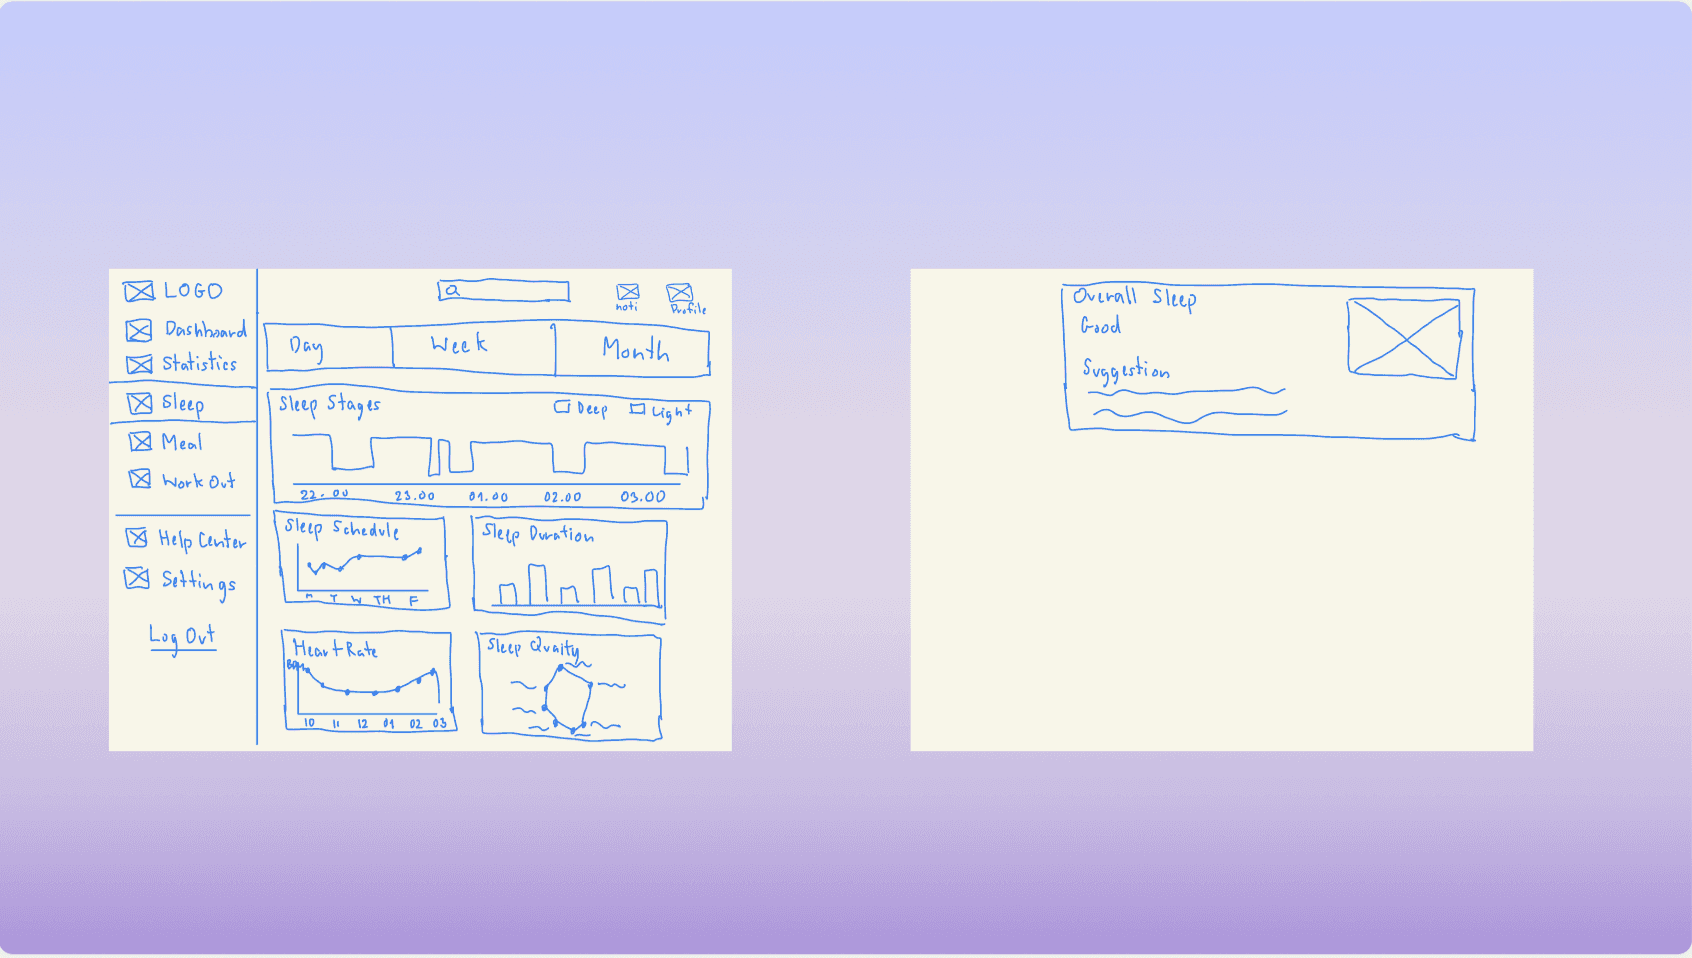
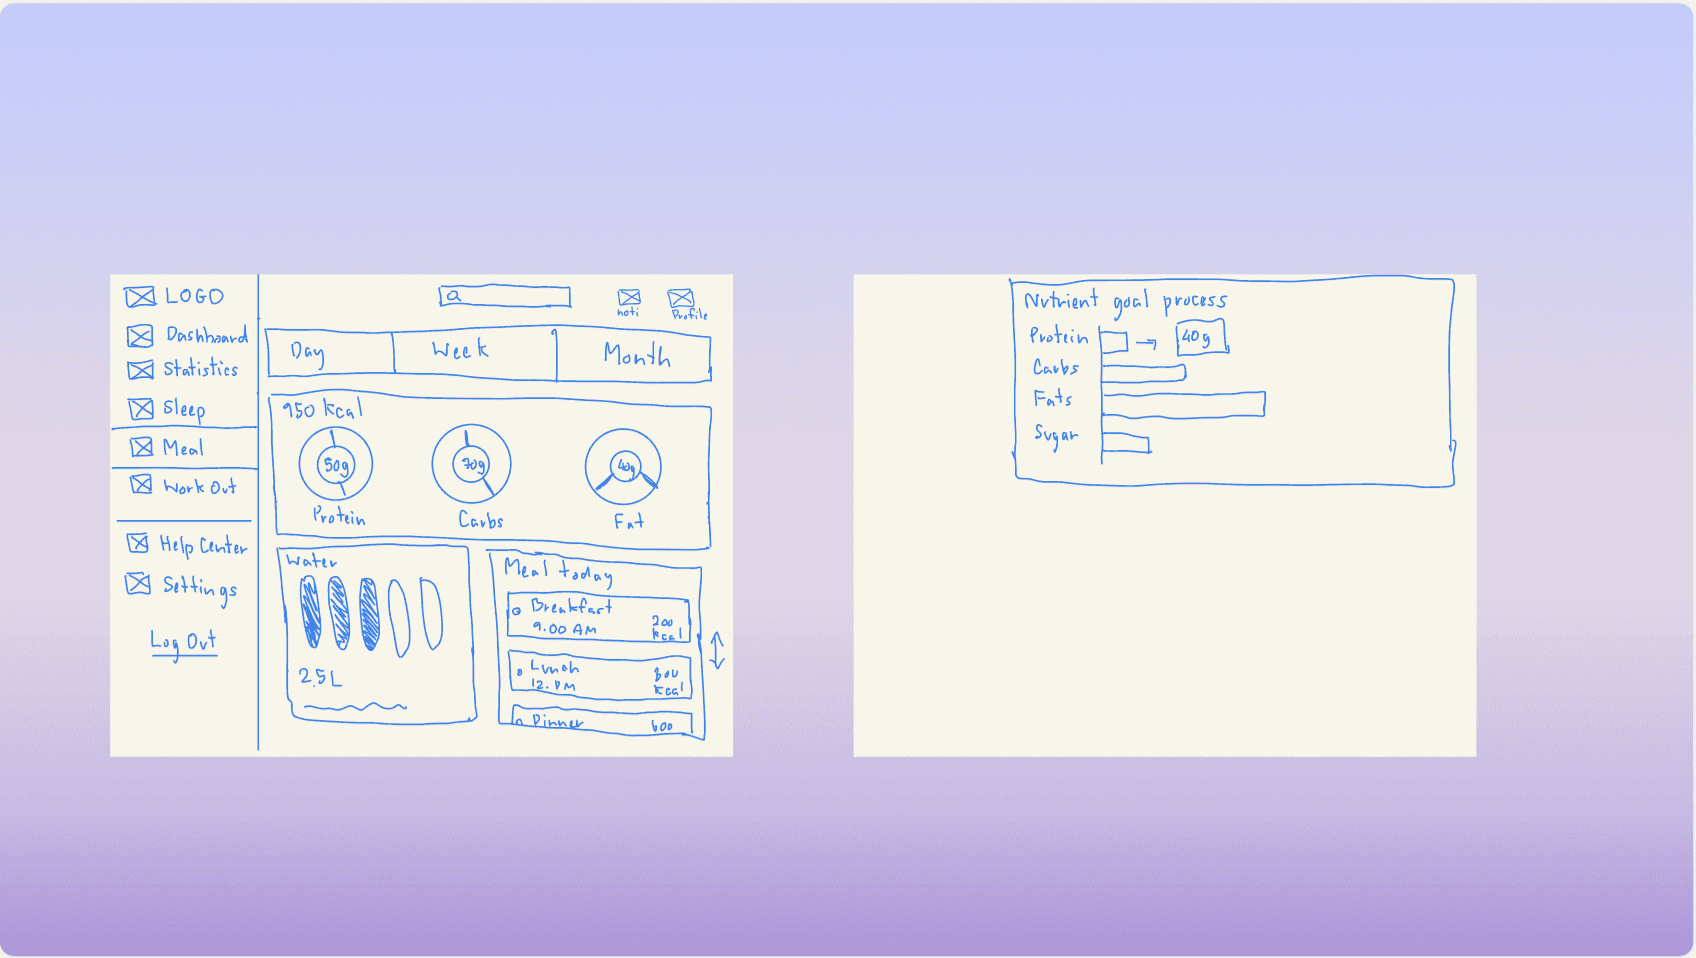
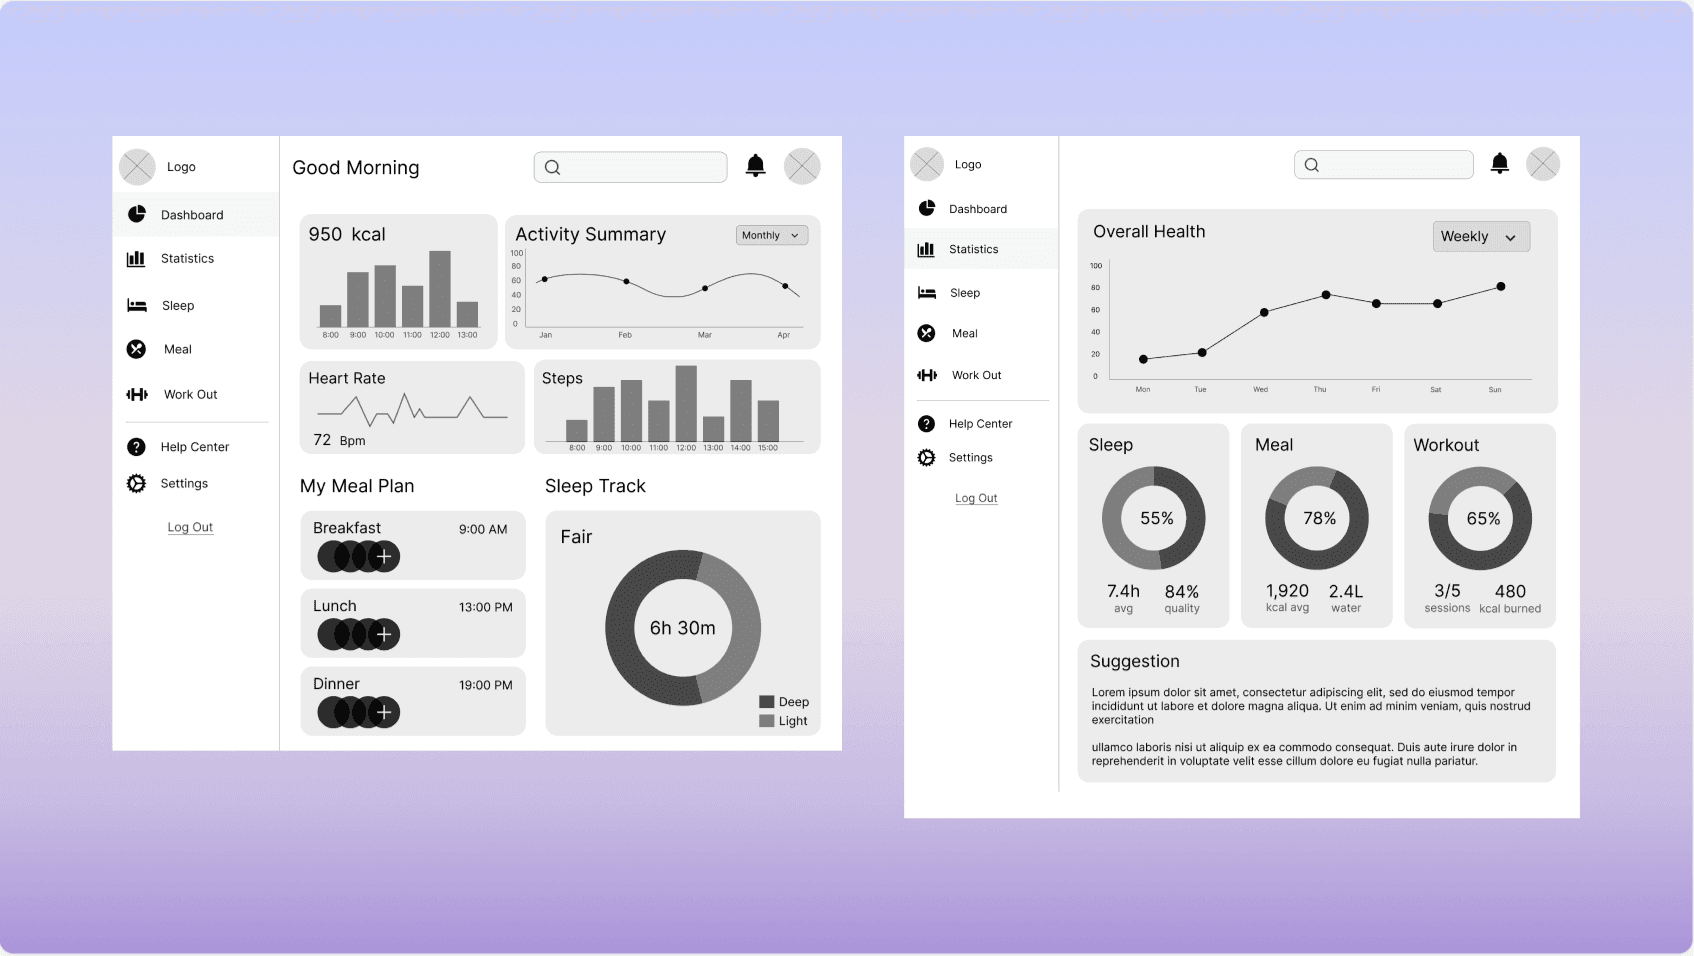
Wireframes
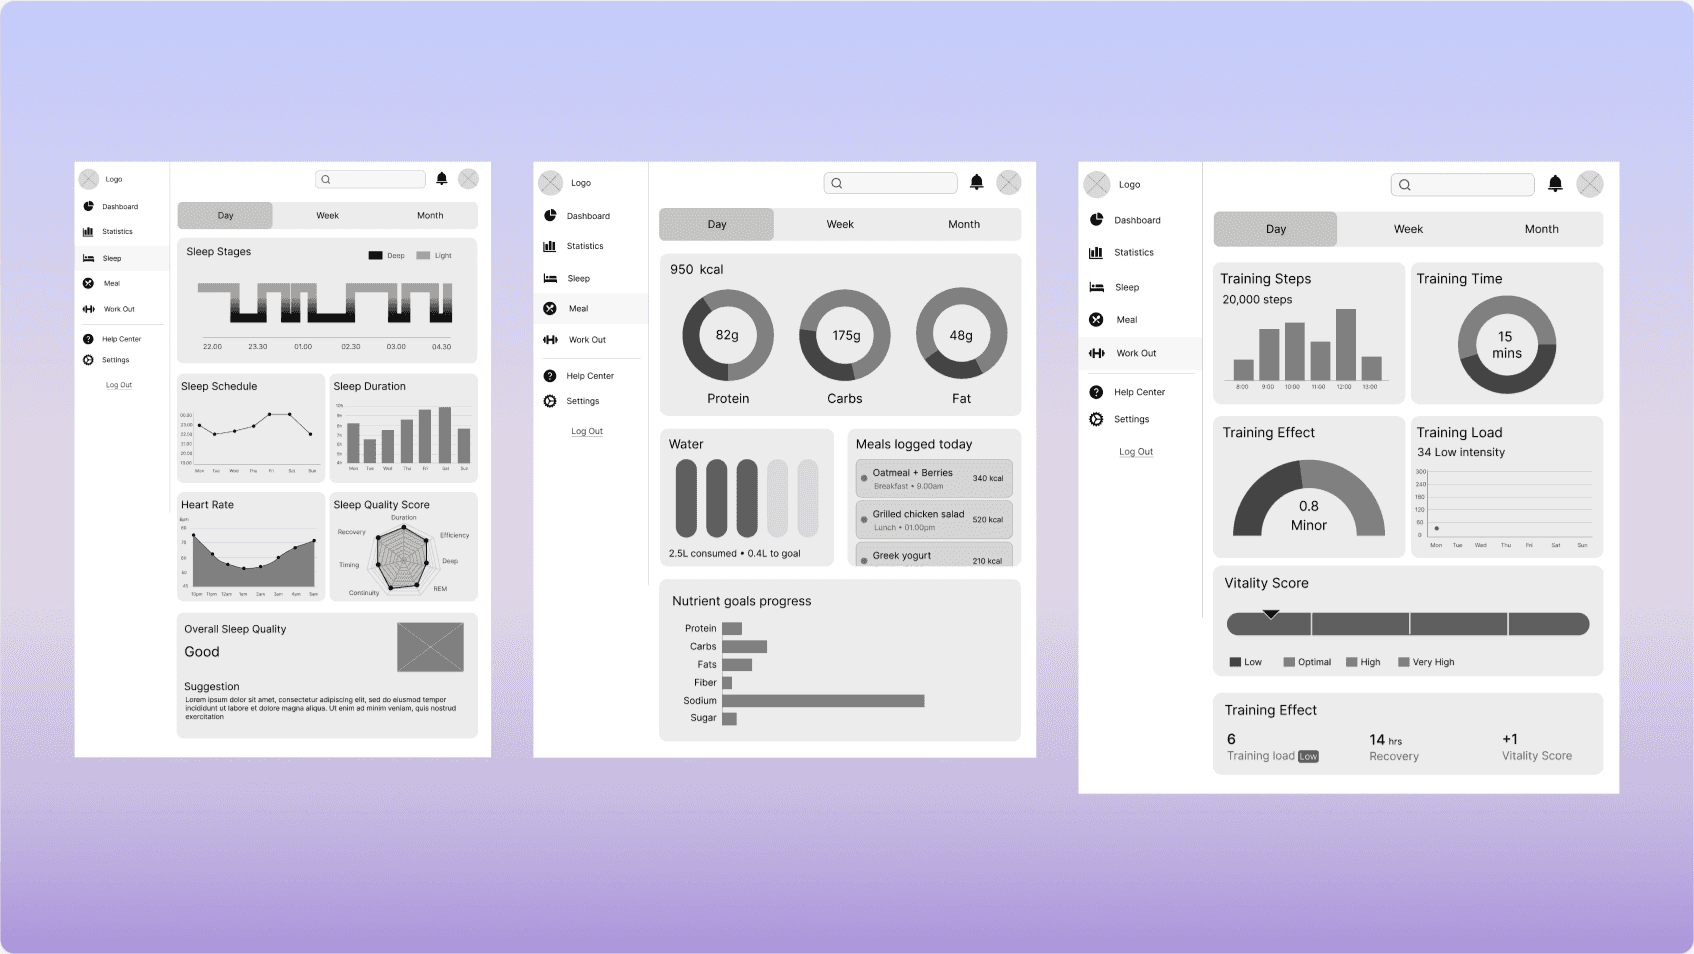
High-fidelity Wireframes